 Plot and customize any 2D or 3D equation.
Function Graph! Graphing equations never been easier...
Graphing equations has never been any easier! This function grapher is as easy to use as typing down the desired equation (e.g. y=sinx+x2) and clicking on the Draw button to graph the equation. 3D graphing can be achieved by simply introducing a "z" variable in the equation. You can customize the axis by specifying the number of divisions, number of units in each division, color, thickness and more.
Advanced function graph software for graphing equations ...
Graph equations of any complexity! The advanced function calculator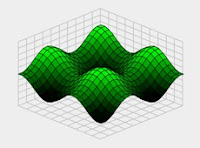 included in the graphing software can handle any equation. Most function graphers such as TI 83 graphing calculator put limitations on the format of the equations to be drawn. For example they can only plot equations that begin with y= or z=. A&G Grapher however can handle any combination of x y z variables. Therefore equations can be as simple as y=sin(x) or as complex as y+xy = sin(x).
Graph equation and use the available tools...
In addition to graphing equations, there are several tools included in this advanced function grapher for analyzing and modifying the plotted graphs. These tools can be used for rotation, matrix manipulation, computation of area under the curve, plotting slopes and tracing graphs. Graphs can be printed, or saved as BMB picture files or copied and pasted in your word
Graphing equations has never been any easier! This function grapher is as easy to use as typing down the desired equation (e.g. y=sinx+x2) and clicking on the Draw button to graph the equation. 3D graphing can be achieved by simply introducing a "z" variable in the equation. You can customize the axis by specifying the number of divisions, number of units in each division, color, thickness and more.
Advanced function graph software for graphing equations ...
Graph equations of any complexity! The advanced function calculator
 included in the graphing software can handle any equation. Most function graphers such as TI 83 graphing calculator put limitations on the format of the equations to be drawn. For example they can only plot equations that begin with y= or z=. A&G Grapher however can handle any combination of x y z variables. Therefore equations can be as simple as y=sin(x) or as complex as y+xy = sin(x).
Graph equation and use the available tools...
In addition to graphing equations, there are several tools included in this advanced function grapher for analyzing and modifying the plotted graphs. These tools can be used for rotation, matrix manipulation, computation of area under the curve, plotting slopes and tracing graphs. Graphs can be printed, or saved as BMB picture files or copied and pasted in your word
 document. * Graph equations with unlimited complexity: o 2D example: y+xy = sinx o 3D graphing example: x+z=siny-cosz * Quick tools for zooming in and out and changing axis center * Customizable graph axis, resolution, color, rendering * Modifier tools such as Matrix transformation and rotation * Analyzer tools such as tracing, area under the curve calculation, slope calculation, x-y-z value table * Print and Preview tools * Ability to save equations as Rich Text Format (*.rtf) files * Ability to save graphs as Bitmap (*.bmb) files * Ability to copy graphs and paste them in other applications
 In order to plot the graph of an equation follow these simple steps:
(1) Type the equation in the equation box As soon as you start
 typing a new equation, a check mark will automatically appear in the corresponding selection box. If you want to prevent an equation from being graphed, then simply uncheck the selection box.
For multiplication, you ncan omit the multiplication sign (*). For example instead of 2*x you can simply type 2x. Other examples include 2(x), 2(x+y) and 2xy.
If you want to raise an expression to a power of some number or expression (e.g. x2), use the key. The equation editor will 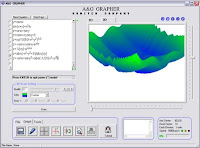 automatically shift the power part of the expression up. Press the Enter key to return to the base line.
 automatically shift the power part of the expression up. Press the Enter key to return to the base line.
 When typing functions such as sin() or cos(), you only need to type the first letter and the editor will automatically fill-in the rest. The following table summarized the functions that are supported:
Functions = Short keys
sin=s
cos=c
tan=t
asin (arcsine) = as
acos (arccosine) = ac
atan (arctangent) = at
abs (absolute value) = ab
log = l
e (constant e) = e
(2) Click on Draw button You can also press the shot-keys Ctrl+Enter to draw the equations. Other short-keys include Ctrl+'+' to zoom-in or Ctrl+'-' to zoom-out or Ctrl+'X' to reset the axis center.